
Exploration in Excel
by Venessa Brown
The goal of the assignment is to exploration and show how excel can be used as a dynamic tools in Mathematics Education.
1. Exploring the equations of lines:
With the use of the scroll bar and scatter plot, I explored the equation of a line in the y = mx + b form. As I move my scroll bar for m and b, the scatter plot changes accordingly. The concept of slope is easliy observed, as well as the y-intercept of the line.
| Equation of a line y = mx+ b | ||||||||||||
| m | b | |||||||||||
| 3 | 2 | |||||||||||
| x | y | |||||||||||
| 0 | 2 |  |
||||||||||
| 1 | 5 | |||||||||||
| 2 | 8 | |||||||||||
| 3 | 11 | |||||||||||
| 4 | 14 | |||||||||||
| 5 | 17 | |||||||||||
| 6 | 20 | |||||||||||
| 7 | 23 | |||||||||||
| 8 | 26 | |||||||||||
| 9 | 29 | |||||||||||
| 10 | 32 | |||||||||||
| 11 | 35 | |||||||||||
| 12 | 38 | |||||||||||
| 13 | 41 | |||||||||||
| 14 | 44 | |||||||||||
2. Pascal's Triangle
We can use excel to recreat Pascal's Triangle.
| 1 | |||||
| 1 | 1 | ||||
| 1 | 2 | 1 | |||
| 1 | 3 | 3 | 1 | ||
| 1 | 4 | 6 | 4 | 1 | |
| 5 | 10 | 10 | 5 | 1 | |
| 15 | 20 | 15 | 6 | 1 | |
| 35 | 35 | 21 | 7 | 1 | |
| 70 | 56 | 28 | 8 | 1 | |
| 126 | 84 | 36 | 9 | 1 | |
| 210 | 120 | 45 | 10 | 1 | |
| 330 | 165 | 55 | 11 | 1 | |
| 495 | 220 | 66 | 12 | 1 | |
| 715 | 286 | 78 | 13 | 1 | |
| 1001 | 364 | 91 | 14 | 1 | |
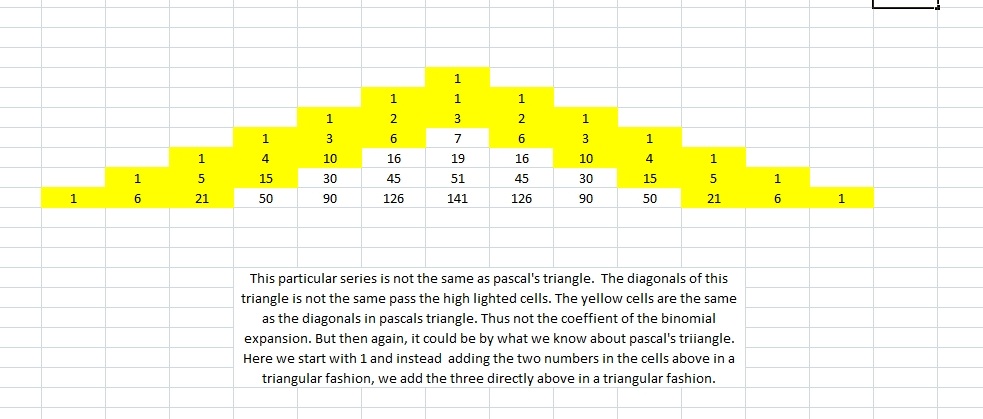
| After putting formula to add cell above and the cell above and to the right. The numbers of pascal would be on the left side (reverse of what we are used to seeing). This happened because as we add cells to the right we pass the original cell thus these cell contain a zero. The other fall to the left. | |||||
3. Adjusting Pascal's Triangle:
4. Excel is a very useful tool in statistic. Let's take the commonly use "roll a die problem"
and use excel to do to some experimental statistic.
| *=int(rand()*6+1* | ||||||||||||||
| Rolls | Outcome | |||||||||||||
| 1 | 4 | |||||||||||||
| 2 | 1 |  |
||||||||||||
| 3 | 1 | |||||||||||||
| 4 | 2 | |||||||||||||
| 5 | 3 | *=countif(array, criteria)* | ||||||||||||
| 6 | 4 | 1's | 4 | |||||||||||
| 7 | 3 | 2's | 5 | |||||||||||
| 8 | 6 | 3's | 3 | |||||||||||
| 9 | 1 | 4's | 2 | |||||||||||
| 10 | 5 | 5's | 4 | |||||||||||
| 11 | 2 | 6's | 2 | |||||||||||
| 12 | 2 | |||||||||||||
| 13 | 3 | |||||||||||||
| 14 | 2 | |||||||||||||
| 15 | 6 | |||||||||||||
| 16 | 2 | |||||||||||||
| 17 | 5 | |||||||||||||
| 18 | 5 | |||||||||||||
| 19 | 5 | |||||||||||||
| 20 | 1 | |||||||||||||
5. Fibinacci and Golden Ratio
| Fn = Fn-1+Fn-2 | ratio (Fn / Fn-1) | Fn = Fn-1+Fn-2 | ratio (Fn / Fn-1) | Fn = Fn-1+Fn-2 | ratio (Fn / Fn-1) | Fn = 2Fn-1+Fn-2 | ratio (Fn / Fn-1) | |||
| 1 | - | 2 | - | 0 | - | 1 | - | |||
| 1 | 1 | 2 | 1 | 3 | 1 | 1 | ||||
| 2 | 2 | 4 | 2 | 3 | 1 | 3 | 3 | |||
| 3 | 1.5 | 6 | 1.5 | 6 | 2 | 7 | 2.333333333 | |||
| 5 | 1.666666667 | 10 | 1.666666667 | 9 | 1.5 | 17 | 2.428571429 | |||
| 8 | 1.6 | 16 | 1.6 | 15 | 1.666666667 | 41 | 2.411764706 | |||
| 13 | 1.625 | 26 | 1.625 | 24 | 1.6 | 99 | 2.414634146 | |||
| 21 | 1.615384615 | 42 | 1.615384615 | 39 | 1.625 | 239 | 2.414141414 | |||
| 34 | 1.619047619 | 68 | 1.619047619 | 63 | 1.615384615 | 577 | 2.414225941 | |||
| 55 | 1.617647059 | 110 | 1.617647059 | 102 | 1.619047619 | 1393 | 2.414211438 | |||
| 89 | 1.618181818 | 178 | 1.618181818 | 165 | 1.617647059 | 3363 | 2.414213927 | |||
| 144 | 1.617977528 | 288 | 1.617977528 | 267 | 1.618181818 | 8119 | 2.4142135 | |||
| 233 | 1.618055556 | 466 | 1.618055556 | 432 | 1.617977528 | 19601 | 2.414213573 | |||
| 377 | 1.618025751 | 754 | 1.618025751 | 699 | 1.618055556 | 47321 | 2.414213561 | |||
| 610 | 1.618037135 | 1220 | 1.618037135 | 1131 | 1.618025751 | 114243 | 2.414213563 | |||
| 987 | 1.618032787 | 1974 | 1.618032787 | 1830 | 1.618037135 | 275807 | 2.414213562 | |||
| 1597 | 1.618034448 | 3194 | 1.618034448 | 2961 | 1.618032787 | 665857 | 2.414213562 | |||
| 2584 | 1.618033813 | 5168 | 1.618033813 | 4791 | 1.618034448 | 1607521 | 2.414213562 | |||
| 4181 | 1.618034056 | 8362 | 1.618034056 | 7752 | 1.618033813 | 3880899 | 2.414213562 | |||
| 6765 | 1.618033963 | 13530 | 1.618033963 | 12543 | 1.618034056 | 9369319 | 2.414213562 | |||
| 10946 | 1.618033999 | 21892 | 1.618033999 | 20295 | 1.618033963 | 22619537 | 2.414213562 | |||
| 17711 | 1.618033985 | 35422 | 1.618033985 | 32838 | 1.618033999 | 54608393 | 2.414213562 | |||
| 28657 | 1.61803399 | 57314 | 1.61803399 | 53133 | 1.618033985 | 131836323 | 2.414213562 | |||
| 46368 | 1.618033988 | 92736 | 1.618033988 | 85971 | 1.61803399 | 318281039 | 2.414213562 | |||
| 75025 | 1.618033989 | 150050 | 1.618033989 | 139104 | 1.618033988 | 768398401 | 2.414213562 |